Realtime Graphs
The Realtime Graphs page provides live visibility into router performance, network traffic, wireless signal quality, and active connections. All graphs update every 3 seconds and display a rolling window of recent history. This page is the primary tool for on-the-spot diagnostics when investigating connectivity, throughput, or performance issues.
Navigation
Status > Realtime Graphs
The page is divided into four tabs: Load, Traffic, Wireless, and Connections.
Load
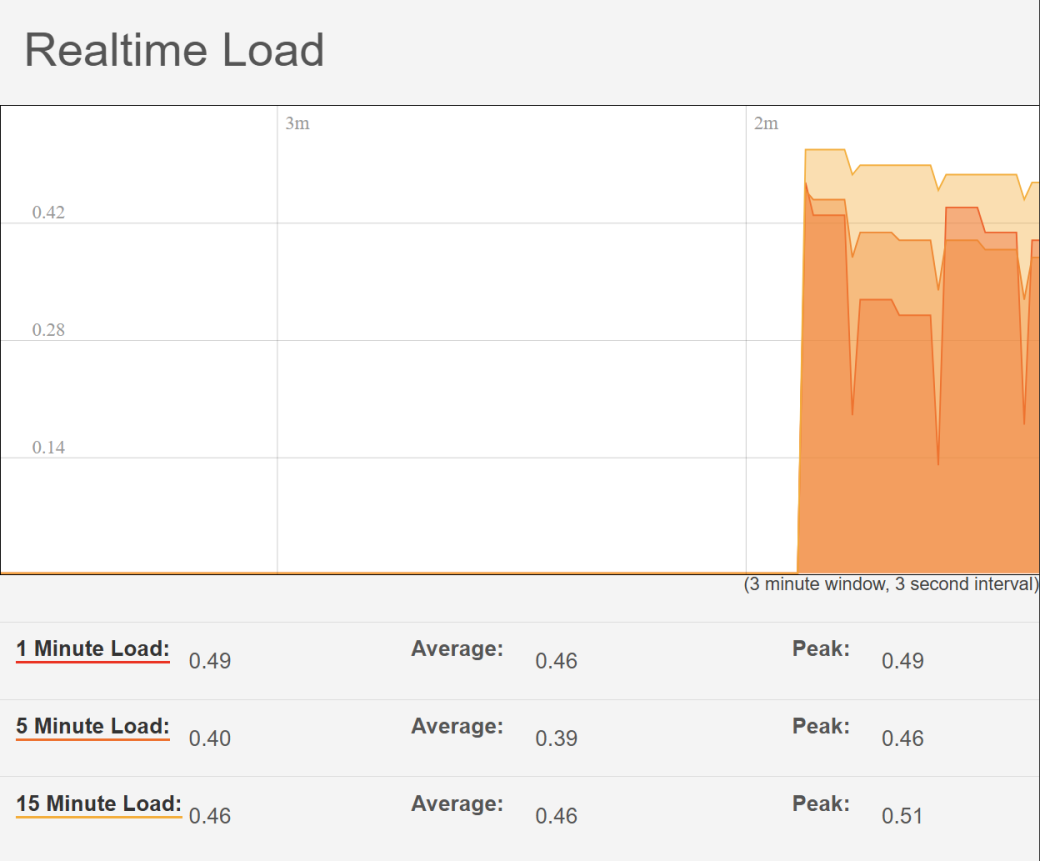
The Load tab displays CPU utilisation over time as a stacked area graph. It shows three rolling averages, updated every 3 seconds within a 4-minute window.
| Metric | Description |
|---|---|
| 1 Minute Load | Average CPU load over the last 60 seconds. The most responsive indicator — reflects what the router is doing right now. |
| 5 Minute Load | Average over the last 5 minutes. A useful middle ground between instant and sustained load. |
| 15 Minute Load | Average over the last 15 minutes. Shows sustained load trends rather than brief spikes. |
Load values are expressed as a fraction of a single CPU core. A value of 1.0 represents 100% of one core. Values consistently above 1.0 indicate the processor is saturated. The three layers are stacked on the graph — the widest (bottom) layer is the 15-minute average and the narrowest (top) layer is the 1-minute average.
Below the graph, each metric shows its current value alongside the session Average and Peak since the page was opened.
Interpreting load values
| Load value | Interpretation |
|---|---|
0.0 – 0.5 |
Normal idle or light use |
0.5 – 1.0 |
Moderate use — typical during active VPN tunnels, NAT, or multiple client traffic |
1.0+ |
CPU saturation — may cause increased latency, packet loss, or slow WebUI response |
Note: A brief spike in the 1-minute load is normal during configuration saves or firmware operations. Sustained high load (15-minute average above 1.0) warrants investigation — check active VPN sessions, traffic volumes, and any scheduled tasks.
Traffic
The Traffic tab shows inbound and outbound throughput in real time for each network interface. All interfaces present on the router appear as sub-tabs — select a tab to display traffic for that interface.
Interface sub-tabs
| Interface | Description |
|---|---|
| br-lan | The LAN bridge interface — aggregate of all wired LAN ports and Wi-Fi traffic passing through the LAN zone |
| Bridge | The underlying bridge device |
| Wired-LAN | Physical wired LAN port traffic only |
| Wired-WAN | Traffic on the wired WAN port, if in use |
| gretap0 | GRE tunnel interface — shows traffic if a GRE tunnel is active |
| ip6tnl0 | IPv6 tunnel interface |
| ip_vti0 | VTI (Virtual Tunnel Interface) — used by IPsec route-based tunnels |
| ifmobile | Mobile (4G/5G) interface — shows cellular data throughput |
| WiFi | Wi-Fi interface traffic only |
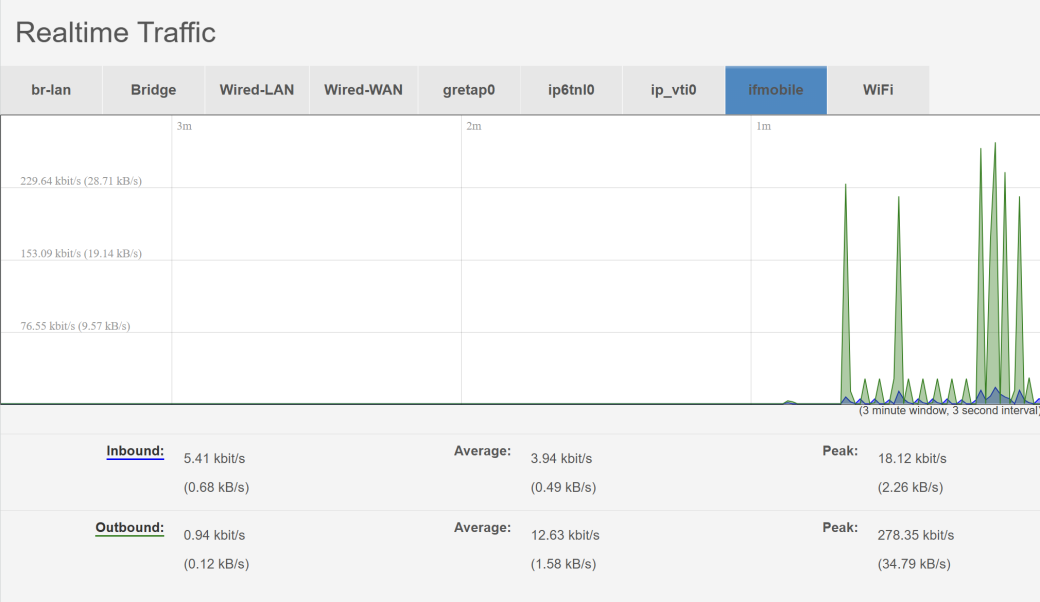
The graph displays a 3-minute rolling window at 3-second intervals. Below the graph, current, average, and peak values are shown for both Inbound and Outbound traffic in kbit/s and kB/s.
Practical use
- Use ifmobile to verify that data is flowing over the cellular connection and to check throughput levels
- Use Wired-WAN to confirm traffic on a wired uplink
- Use br-lan or WiFi to identify which LAN clients are generating traffic
- Compare inbound and outbound to identify asymmetric conditions or one-sided traffic flows
Wireless
The Wireless tab shows the signal strength and noise floor of the router's Wi-Fi radio in real time. The WiFi sub-tab represents the 2.4 GHz radio (radio0).
The graph shows a 3-minute rolling window at 3-second intervals. Below the graph:
| Metric | Description |
|---|---|
| Signal | Received signal strength in dBm, plus SNR (Signal-to-Noise Ratio). Displayed for the currently associated client with the strongest signal, or the radio's own receive level. |
| Noise | The ambient RF noise floor at the antenna in dBm. Lower (more negative) is better. |
Reading Wi-Fi signal values
| Signal strength | Quality |
|---|---|
-50 dBm or better |
Excellent — strong signal, maximum throughput |
-60 to -50 dBm |
Good — reliable connection |
-70 to -60 dBm |
Fair — usable but performance may be reduced |
-80 dBm or worse |
Poor — connection unreliable, consider antenna positioning |
Note: If the graph shows a value of
-255 dBm, this indicates no Wi-Fi clients are currently associated or the radio has no active connection to report. This is expected when the Wi-Fi is enabled but no devices are connected.
Connections
The Connections tab provides two views of active network traffic: a graph of connection counts by protocol, and a live table listing every active connection through the router.
Active Connections graph
The stacked area graph shows the number of concurrent active connections, broken down by protocol, over a 3-minute window at 3-second intervals.
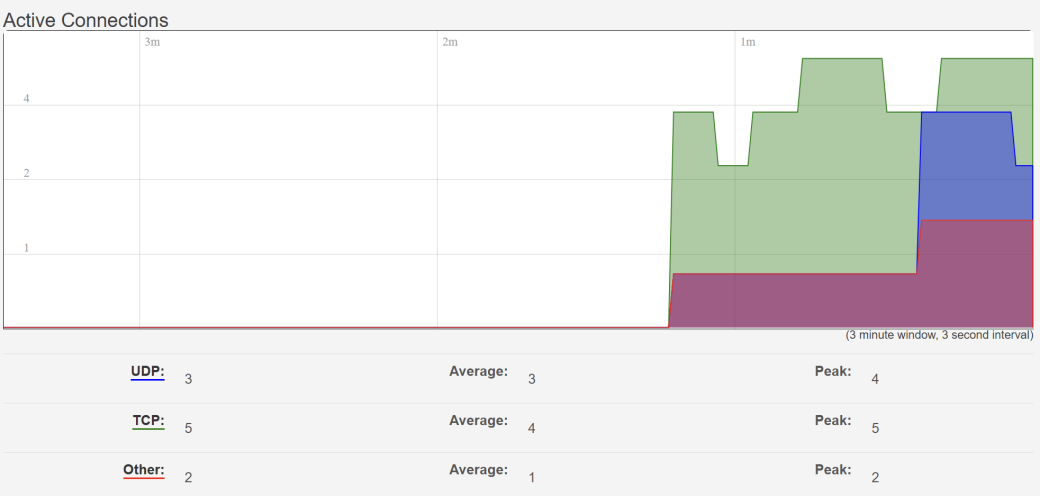
| Protocol | Description |
|---|---|
| UDP | Connectionless datagrams — DNS queries, VoIP, NTP, and most VPN keepalives |
| TCP | Connection-oriented sessions — HTTP/HTTPS, SSH, RDP, and most application traffic |
| Other | ICMP, IGMP, and other non-TCP/UDP traffic |
Below the graph, current, average, and peak connection counts are shown for each protocol.
Connection table
Below the graph, a table lists every active connection tracked by the router's conntrack table. The table refreshes automatically.
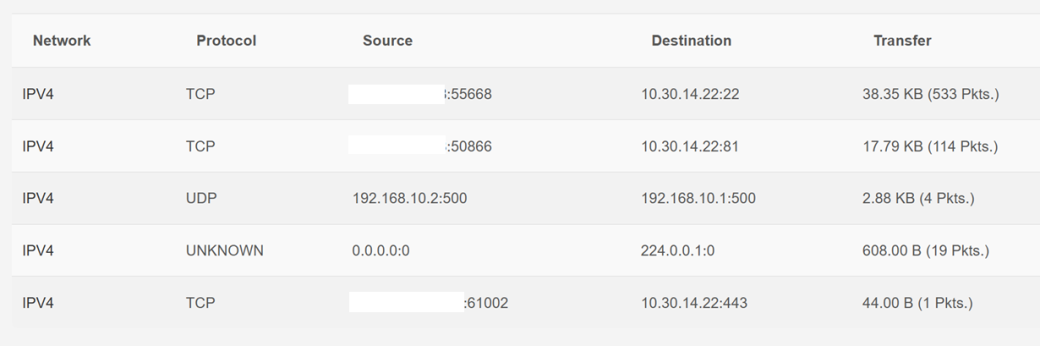
| Column | Description |
|---|---|
| Network | Address family — IPV4 or IPV6 |
| Protocol | Transport protocol — TCP, UDP, ICMP, or UNKNOWN |
| Source | Source IP address and port of the connection |
| Destination | Destination IP address and port |
| Transfer | Total data transferred and packet count for this connection since it was established |
Reading the connection table
The table is particularly useful for identifying what the router and attached devices are communicating with. Common patterns to look for:
| What you see | What it means |
|---|---|
UDP to port 53 (e.g. 8.8.8.8:53) |
DNS resolution — normal background traffic from the router or LAN clients |
UDP to/from port 500 or 4500 |
IKE/IPsec VPN negotiation or keepalive traffic |
TCP to port 22 |
An active SSH session — inbound means someone is connected to the router |
TCP to port 80 or 443 |
HTTP/HTTPS traffic from LAN clients or the router itself |
| ICMP connections | Ping traffic — useful to confirm the ICMP check / ping reboot feature is active |
Destination 224.x.x.x |
Multicast traffic — normal for network protocols such as mDNS and IGMP |
| Unexpected external IPs with high transfer | May indicate an unintended outbound connection — cross-reference against known services |
Note: The connection table reflects the router's conntrack state, not a packet capture. Short-lived connections (e.g. individual DNS queries) may have already closed by the time they appear, so they may not always be visible.